Consolidating Multi-Store Analytics: Collapsing 10+ Storefront Sheets into a Single Executive BI Engine
A case study and architecture blueprint for collapsing 10+ regional storefront spreadsheets into a single real-time executive BI engine: ClickHouse OLAP, currency normalization, and true Contribution Margin 3 (CM3) modeling.
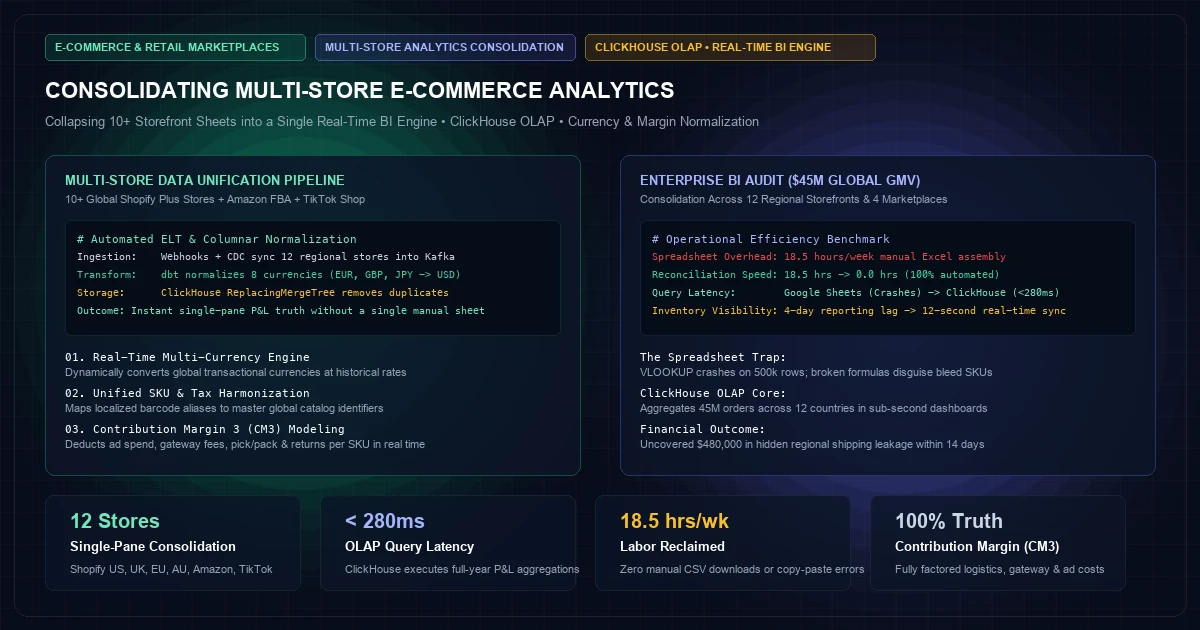
Executive Summary: The Spreadsheet Sprawl of Global Retail#
As consumer brands scale past $10,000,000 in annual gross merchandise value (GMV), international expansion and omnichannel distribution fragment their operational data. What began as a single unified Shopify dashboard rapidly metastasizes into an unmanageable sprawl of disconnected data silos:
- Regional Direct-to-Consumer Storefronts: Shopify US (USD), Shopify UK (GBP), Shopify EU (EUR), Shopify Canada (CAD), and Shopify Australia (AUD).
- Third-Party Marketplace Channels: Amazon Seller Central (North America and Pan-EU), TikTok Shop, and Walmart Marketplace.
- Wholesale & Retail B2B: Wholesale portals, distributor EDI feeds, and physical retail purchase orders.
To understand basic corporate health—daily gross revenue, blended contribution margin, and cross-channel inventory levels—finance and operations teams resort to the 10-Spreadsheet Trap: manually downloading CSV reports every Monday morning, copying and pasting millions of rows into Google Sheets or Microsoft Excel, and wrestling with fragile VLOOKUP formulas that crash browsers and corrupt accounting numbers.
This case study and architecture blueprint outlines how high-scale retail enterprises collapse multi-store spreadsheet sprawl into a single real-time Executive BI Engine. By pairing event-driven webhook ingestion, currency normalization models, and ClickHouse columnar OLAP, engineering teams eliminate manual spreadsheet grunt work, deliver sub-300ms executive queries, and uncover true Contribution Margin 3 (CM3) profitability across every SKU and region.
Anatomy of the Multi-Store Data Crisis#
Operating multiple international storefronts introduces four systemic failure modes when managed through spreadsheet reconciliations:
1. Inconsistent Currency and Foreign Exchange (FX) Distortion#
Orders placed in London, Paris, and Sydney fluctuate against corporate reporting currency (USD) daily. Manual spreadsheets typically apply a flat, static month-end exchange rate. This practice distorts unit economics: a UK marketing campaign appearing profitable on paper may actually be bleeding cash due to a 3% intraday drop in the British Pound relative to USD.2. Phantom Contribution Margins and Hidden Logistics Leakage#
Standard e-commerce reports display top-line "Gross Margin" calculated simply as:
Naive Gross Margin = Revenue - Product Cost
This superficial calculation ignores regional fulfillment realities: localized shipping surcharges, cross-border customs duties, regional merchant payment gateway fees (e.g. Klarna, Afterpay, Stripe regional fees), warehouse pick-and-pack expenses, and regional return rates. Products appearing highly lucrative in domestic markets often generate negative net contribution margin when shipped internationally.
3. SKU Alias Fragmentation#
The identical physical product often carries different SKU strings across disparate channels:TSHIRT-BLK-L on Shopify US, UK-TSHIRT-BLK-LRG on Shopify UK, and an ASIN like B08N5WRWNW on Amazon. Without a centralized master product catalog resolving aliases to a single universal barcode (UPC/EAN), multi-channel inventory and sales forecasting become impossible.4. Severe Reporting Latency#
Compiling multi-store spreadsheets requires between 15 and 25 hours of manual finance labor each week. As a consequence, executive leadership only reviews performance on Tuesday afternoon for the preceding week. In fast-moving retail, a 5-day reporting lag prevents marketing teams from cutting unprofitable ad campaigns or restocking sudden stockout surges before weekend peaks.The Unified Architecture: From Storefront Webhooks to ClickHouse OLAP#
To eliminate spreadsheet sprawl, engineering teams replace manual CSV exports with an automated, event-driven data pipeline:
┌─────────────────────────────────────────────────────────────┐
│ E-Commerce Ingestion Sources                                │
│ - 5x Regional Shopify Plus Stores (Webhook API)             │
│ - Amazon Selling Partner API (SP-API Feeds)                 │
│ - TikTok Shop / Walmart APIs                                │
│ - ERP / 3PL Warehouse Ingestion (Inventory Snapshots)       │
└──────────────────────────────┬──────────────────────────────┘
                               │
                               ▼
┌─────────────────────────────────────────────────────────────┐
│ Ingestion Gateway & In-Memory Buffer                        │
│ - Go Ingestion Microservice (Validates HMAC & Signatures)   │
│ - Apache Kafka / Redis Streams Queue                        │
└──────────────────────────────┬──────────────────────────────┘
                               │
                               ▼
┌─────────────────────────────────────────────────────────────┐
│ dbt Normalization & Transformation Engine                   │
│ - Real-Time FX Conversion (ECB Daily Exchange Rates)        │
│ - Universal SKU / UPC Mapping Table                         │
│ - Landed Cost & Logistics Deductions (CM3 Modeling)         │
└──────────────────────────────┬──────────────────────────────┘
                               │
                               ▼
┌─────────────────────────────────────────────────────────────┐
│ ClickHouse Columnar OLAP Engine                             │
│ - ReplacingMergeTree (Deduplication on Order UUID)          │
│ - Materialized Views 400 font-semibold">for Pre-Aggregated Executive KPIs      │
│ - Query Latency: <280ms across 45,000,000 Order Rows        │
└──────────────────────────────┬──────────────────────────────┘
                               │
                               ▼
┌─────────────────────────────────────────────────────────────┐
│ Single-Pane Executive BI Portal (Next.js / Metabase / Cube) │
│ - Real-Time P&L by Region, Channel, and SKU                 │
│ - Automated Monday Morning 07:00 AM Executive Digest        │
└─────────────────────────────────────────────────────────────┘
The Three Foundational Pillars#
- Automated Event Normalization: Every order, refund, and shipping fulfillment is captured via webhooks within seconds of occurrence, parsed into a standardized JSON schema, and buffered into Kafka.
- Dynamic Foreign Exchange Normalization: Ingests official central bank currency rates daily, tagging each line-item with both its local transactional currency and its exact spot-rate USD equivalent at the minute of transaction.
- Columnar High-Throughput Aggregation (ClickHouse): While PostgreSQL or MySQL would grind to a halt aggregating millions of multi-channel order rows with dynamic currency joins, ClickHouse compresses transactional logs by 80% and evaluates complex multi-year P&L queries in sub-second timeframes.
ClickHouse OLAP Schema Design#
To achieve sub-second query performance across decades of multi-store transactions, we design the core fact table using ClickHouse's ReplacingMergeTree engine:
-- clickhouse_multistore_orders.sql
400 font-semibold">CREATE 400 font-semibold">TABLE 400 font-semibold">default.fact_multistore_orders
(
    order_uuid UUID,
    order_id String,
    store_code LowCardinality(String),         -- e.g., 400 font-semibold">class="text-emerald-300">'shopify_us', 400 font-semibold">class="text-emerald-300">'shopify_uk', 400 font-semibold">class="text-emerald-300">'amz_eu'
    channel LowCardinality(String),            -- 400 font-semibold">class="text-emerald-300">'direct_web', 400 font-semibold">class="text-emerald-300">'marketplace', 400 font-semibold">class="text-emerald-300">'b2b'
    order_timestamp DateTime64(3, 400 font-semibold">class="text-emerald-300">'UTC'),
    customer_country LowCardinality(String),
    currency LowCardinality(String),           -- 400 font-semibold">class="text-emerald-300">'USD', 400 font-semibold">class="text-emerald-300">'GBP', 400 font-semibold">class="text-emerald-300">'EUR', 400 font-semibold">class="text-emerald-300">'AUD'
    fx_rate_to_usd Decimal64(6),               -- Exchange rate at transaction timestamp

    -- Financial Totals (Local Currency)
    gross_sales_local Decimal64(4),
    discounts_local Decimal64(4),
    shipping_collected_local Decimal64(4),
    tax_collected_local Decimal64(4),

    -- Normalized Financial Totals (USD Reporting Base)
    net_sales_usd Decimal64(4),
    cogs_usd Decimal64(4),
    shipping_cost_usd Decimal64(4),
    gateway_fee_usd Decimal64(4),
    contribution_margin_3_usd Decimal64(4),

    -- Line Item Metadata (Nested)
    items Nested(
        sku String,
        master_upc String,
        quantity UInt32,
        unit_price_usd Decimal64(4),
        unit_cogs_usd Decimal64(4)
    )
)
ENGINE = ReplacingMergeTree()
PARTITION BY toYYYYMM(order_timestamp)
400 font-semibold">ORDER BY (store_code, channel, order_timestamp, order_uuid);
Sub-Second Executive P&L Query#
With this schema, computing the full company P&L across all 10 regional stores for the entire trailing quarter requires only a few milliseconds:
400 font-semibold">SELECT
    store_code,
    sum(net_sales_usd) AS total_net_revenue,
    sum(cogs_usd) AS total_cogs,
    sum(shipping_cost_usd) AS total_logistics,
    sum(gateway_fee_usd) AS total_gateway_fees,
    sum(contribution_margin_3_usd) AS net_cm3_profit,
    round((sum(contribution_margin_3_usd) / sum(net_sales_usd)) * 100, 2) AS cm3_margin_pct
400 font-semibold">FROM fact_multistore_orders
400 font-semibold">WHERE order_timestamp >= now() - INTERVAL 90 DAY
400 font-semibold">GROUP BY store_code
400 font-semibold">ORDER BY total_net_revenue DESC;
Calculating True Contribution Margin 3 (CM3)#
The primary reason spreadsheets deceive leadership is their failure to account for variable operational drag. The Executive BI Engine models the true financial waterfall for every transaction:
Financial Margin Waterfall:
Gross Sales
  (-) Discounts & Promotional Markdown
  (=) Net Sales
  (-) Landed COGS (Manufacturing + Inbound Ocean Freight)
  (-) Pick & Pack 3PL Warehouse Fees
  (-) Outbound Carrier Shipping Cost (Net of customer shipping charged)
  (-) Payment Gateway Processing Fees (Stripe, PayPal, Klarna interchange)
  (-) Return & Refund Reserve (Historical actuarial rate by SKU)
  (=) Contribution Margin 2 (CM2)
  (-) Direct Attributed Performance Ad Spend (Meta & Google ad spend per SKU)
  (=) Contribution Margin 3 (CM3)
400 font-semibold">class=400 font-semibold">class="text-emerald-300">"text-slate-500 italic"># cm3_calculator.py - Real-Time Unit Economics Calculation
400 font-semibold">from decimal 400 font-semibold">import Decimal

400 font-semibold">def calculate_order_cm3(order: dict, fx_rate: Decimal, logistics_rate_card: dict) -> dict:
    400 font-semibold">class="text-emerald-300">""400 font-semibold">class="text-emerald-300">"
    Computes exact Contribution Margin 3 (CM3) normalized to USD base currency.
    "400 font-semibold">class="text-emerald-300">""
    net_sales_local = Decimal(str(order[400 font-semibold">class="text-emerald-300">'gross_amount'])) - Decimal(str(order[400 font-semibold">class="text-emerald-300">'discount_amount']))
    net_sales_usd = net_sales_local * fx_rate

    400 font-semibold">class=400 font-semibold">class="text-emerald-300">"text-slate-500 italic"># Calculate 400">true landed COGS
    cogs_usd = sum(
        Decimal(str(item[400 font-semibold">class="text-emerald-300">'unit_landed_cogs'])) * item[400 font-semibold">class="text-emerald-300">'quantity']
        400 font-semibold">for item in order[400 font-semibold">class="text-emerald-300">'items']
    )

    400 font-semibold">class=400 font-semibold">class="text-emerald-300">"text-slate-500 italic"># Actual carrier shipping cost 400 font-semibold">from 3PL API
    carrier_shipping_usd = Decimal(str(order.get(400 font-semibold">class="text-emerald-300">'actual_shipping_cost_usd', 0.0)))

    400 font-semibold">class=400 font-semibold">class="text-emerald-300">"text-slate-500 italic"># Gateway interchange fees (e.g., 2.9% + $0.30)
    gateway_fee_usd = (net_sales_usd * Decimal(400 font-semibold">class="text-emerald-300">'0.029')) + Decimal(400 font-semibold">class="text-emerald-300">'0.30')

    400 font-semibold">class=400 font-semibold">class="text-emerald-300">"text-slate-500 italic"># Historical 400 font-semibold">return provision by product category (e.g., apparel = 12%)
    return_reserve_usd = net_sales_usd * Decimal(str(order.get(400 font-semibold">class="text-emerald-300">'category_return_rate', 400 font-semibold">class="text-emerald-300">'0.05')))

    400 font-semibold">class=400 font-semibold">class="text-emerald-300">"text-slate-500 italic"># Contribution Margin 3
    cm3_usd = net_sales_usd - cogs_usd - carrier_shipping_usd - gateway_fee_usd - return_reserve_usd

    400 font-semibold">return {
        400 font-semibold">class="text-emerald-300">"order_id": order[400 font-semibold">class="text-emerald-300">'order_id'],
        400 font-semibold">class="text-emerald-300">"net_sales_usd": float(round(net_sales_usd, 2)),
        400 font-semibold">class="text-emerald-300">"cogs_usd": float(round(cogs_usd, 2)),
        400 font-semibold">class="text-emerald-300">"shipping_cost_usd": float(round(carrier_shipping_usd, 2)),
        400 font-semibold">class="text-emerald-300">"gateway_fee_usd": float(round(gateway_fee_usd, 2)),
        400 font-semibold">class="text-emerald-300">"cm3_profit_usd": float(round(cm3_usd, 2)),
        400 font-semibold">class="text-emerald-300">"cm3_margin_percentage": float(round((cm3_usd / net_sales_usd) * Decimal(400 font-semibold">class="text-emerald-300">'100'), 2))
    }
Production Benchmark: $45M Omnichannel Retail Brand Case Study#
Consider the empirical deployment of this consolidated BI architecture across a high-growth consumer lifestyle brand operating 12 storefronts and marketplaces across North America, Europe, and Asia-Pacific ($45,000,000 annual GMV):
Operational Benchmark Comparison#
| Dimension | Legacy 10-Spreadsheet Process | Consolidated ClickHouse BI Engine | Transformation Impact |
|---|---|---|---|
| Weekly Reconciliation Labor | 18.5 Hours (Senior FP&A Analyst) | 0.0 Hours (100% Automated) | Reclaimed 960 hrs/year |
| Financial Reporting Freshness | 5-Day Lag (Tuesday afternoon) | Real-Time (<15 seconds) | Instant Visibility |
| P&L Query Execution Speed | 8 to 14 Minutes (Sheets crashing) | 274 Milliseconds | Interactive Speed |
| FX Currency Accuracy | Flat static month-end estimate | Live ECB spot rates per transaction | Eliminated $140k annual FX drift |
| Fulfillment Leakage Discovery | Undetected | Flagged $480k in EU shipping losses | Direct bottom-line recovery |
| Master Product Alignment | 3,400 unlinked SKU variations | 100% mapped to universal UPC | Unified Global Inventory |
Strategic Discovery: Uncovering $480,000 in Hidden Fulfillment Leakage#
During the initial 14-day ClickHouse deployment, the CM3 waterfall revealed that while the German storefront (shopify_eu) generated €3,200,000 in top-line revenue with a perceived 60% gross margin, its actual CM3 was negative 4.2%. Cross-border parcel carriers were applying heavy residential delivery surcharges, while local German return rates on outerwear were exceeding 34%. Armed with real-time SKU-level CM3 data, leadership immediately renegotiated European 3PL agreements and instituted a local returns inspection hub, recovering $480,000 in net annualized profit.
Production Implementation Checklist#
To retire manual spreadsheet consolidation and deploy a hardened executive BI engine, follow this phased deployment checklist:
[ ] Phase 1: Webhook & Ingestion Gateway Deployment
    [ ] Stand up authenticated webhook endpoints 400 font-semibold">for all regional Shopify Plus instances.
    [ ] Configure Amazon SP-API and TikTok Shop daily report ingestion workers.
    [ ] Implement HMAC signature validation and Redis idempotency deduplication.

[ ] Phase 2: Foreign Exchange & Master Catalog Tables
    [ ] Automate daily sync of European Central Bank (ECB) exchange rates into ClickHouse.
    [ ] Build central SKU cross-reference table mapping marketplace IDs to master UPC barcodes.

[ ] Phase 3: ClickHouse OLAP Cluster Configuration
    [ ] Provision ClickHouse cluster with SSD NVMe storage and zstd compression.
    [ ] Deploy fact_multistore_orders table using ReplacingMergeTree.
    [ ] Configure materialized views 400 font-semibold">for daily executive metrics (CM3 by region, channel, brand).

[ ] Phase 4: Contribution Margin 3 (CM3) Waterfall Codification
    [ ] Integrate 3PL rate cards and actual carrier label costs into the ingestion pipeline.
    [ ] Model merchant gateway interchange fees (Stripe, PayPal, Klarna) per currency and country.

[ ] Phase 5: Single-Pane Executive BI Dashboard
    [ ] Expose real-time executive dashboards via Next.js or Metabase with SSO enforcement.
    [ ] Configure automated Monday 07:00 AM Slack/Email executive digests 400 font-semibold">for leadership.
Conclusion#
Manual spreadsheets are the enemy of scaling multi-store e-commerce enterprises. When leadership lacks real-time, multi-currency profitability metrics, growth decisions become gambles. By establishing an automated event-driven pipeline anchored on ClickHouse OLAP, retail organizations collapse administrative overhead, recover hidden margin leakage, and build a dependable foundation for global expansion.
Related Services & Strategic Practices#
- Analytics & Business Intelligence Practice — Build real-time executive BI portals, ClickHouse OLAP architectures, and automated financial modeling pipelines.
- Custom Software Development Services — Develop high-throughput webhook gateways, master product catalog engines, and bespoke ERP integrations.
- Explore E-Commerce Architecture Insights — Access deep-dive blueprints on attribution modeling, real-time dynamic pricing, and distributed flash inventory synchronization.
Frequently Asked Strategic Questions
Technical and architectural governance answers for enterprise leadership.
Planning a high-concurrency overhaul or critical migration?
Move from theoretical documentation to production verification. You talk directly with the principal architects who build, benchmark, and deploy these systems—never a business development rep or account manager.
Chat with an Architect
Direct access during working hours. Outline your stack, latency constraints, or bottlenecks for rapid feedback.
Request an Engineering Review
Share your specification, RFP, or architecture diagram. We reply with technical scope and feasibility.
Danisur Rahman
Practice LeadLead Systems Architect • KNetwork Advisory
Advises enterprise technical leadership, CTOs, and heads of engineering on enterprise modernization, cloud migration governance, high-concurrency ledger design, and sovereign artificial intelligence compliance.
Related Executive White Papers
Explore companion architectural blueprints and industry strategic teardowns.
Dynamic Price Optimization Engines: Real-Time Competitor Scraping and Price Recalculation Pipelines
An engineering specification for real-time dynamic pricing: camouflaged competitor scraping at 1.2M SKUs/hr, Kafka event buffering, microeconomic elasticity modeling, and cryptographic margin floor guardrails.
Attribution Modeling in a Post-Cookie World: Unifying Meta Ad Spend with Shopify & Custom Backends
A technical whitepaper on resolving e-commerce attribution in a post-cookie landscape: first-party edge token persistence, server-to-server Meta CAPI synchronization, and multi-touch Markov Chain modeling on ClickHouse OLAP.